Comparing your hotel’s occupancy with an official figure: what is and is not comparable
The official figure is a bed occupancy rate, not a rooms figure. Learn how to restate your data to match the unit, population and period before comparing.
AI draft · awaiting editorial review
Contents
Key takeaways
- Bed occupancy is bednights sold divided by bednights offered for use; rooms-based occupancy is roomnights sold divided by roomnights available, and the two only meet when every room sells at full occupancy.
- The Ministry of Culture and Tourism reports an occupancy rate of 49.54% for 2025 in Ministry-certified (İşletme and Basit) facilities, against 51.91% in 2024, and it is a bed figure (Ministry of Culture and Tourism, accommodation statistics 2025).
- The headline average blends classes: 61.0% for 5-star and 35.1% for pensions in 2025, so compare inside your own class (Ministry of Culture and Tourism, accommodation statistics 2025).
- A gap between your number and the published one is a definition gap until you have matched four things: unit, population, period and capacity offered for use.
- Restating one month in the official unit takes an hour and prevents a decision built on two numbers that were never measuring the same thing.
The published figure is a bed occupancy rate for Ministry-certified facilities: the share of bed capacity offered for use that was used over the period. Your own rooms-based occupancy counts rooms sold against rooms available. The two differ by guests per room and by which facilities sit in the average, so convert before you compare.
Your rooms-based occupancy for last month reads 74%. The published figure is far below it, and the room splits into two camps: one says the market is soft, the other says the hotel is outperforming. Neither claim can be settled until both numbers are in the same unit. This article shows what the official figure measures, which facilities sit inside it, and how to restate one month of your own data so the comparison is honest. If you want to compare hotel occupancy with official statistics, this is the sequence.
Why does your rooms-based occupancy differ from the published figure?
They count different things. Your figure counts rooms sold against rooms available; the published figure counts bednights used against bed capacity offered for use.
Rooms-based occupancy is roomnights sold divided by roomnights available in the period. Bed occupancy is bednights sold divided by bednights offered for use in the same period. The bridge between the two is guests per room and beds per room: bed occupancy equals rooms-based occupancy multiplied by guests per room, divided by beds per room. A hotel offering two beds per room and selling doubles lands near its rooms figure; single travelers in the same rooms pull the bed figure below it.
For example, a 100-room hotel with 200 beds over a 30-day month sells 1,800 roomnights and 3,000 bednights. Rooms-based occupancy is 1,800 divided by 3,000, or 60%. Bed occupancy is 3,000 divided by 6,000, or 50%. Same hotel, same month, ten points apart.
Extra beds, sofa beds and children sharing a bed break the assumption that beds equal twice the rooms. Count the beds you actually offer, not the beds the floor plan implies. Length of stay changes the rhythm of bednights even at constant room occupancy: certified facilities averaged 2.55 nights per stay in 2025 (Ministry of Culture and Tourism, accommodation statistics 2025), and a hotel with a five-night average fills and empties its beds on a different cycle.
| Your rooms-based figure | The published bed figure | |
|---|---|---|
| What is counted | Rooms sold | Bednights used |
| Denominator | Rooms available | Beds offered for use |
| What moves it with no extra sale | Single occupancy, children in a room | A wing taken out of service |
| Question it answers | How full is my sellable room stock | How much of the bed capacity on offer was used |
| Who publishes it | You | Ministry of Culture and Tourism |
Keep both figures. Rooms-based occupancy drives your revenue decisions; bed occupancy is the only one you can put beside the published number. The accommodation statistics terms side by side give the full vocabulary.
What does the official occupancy figure actually measure?
It measures the share of bed capacity offered for use that was used over the period, across Ministry-certified facilities. It is a bed occupancy rate, and no rooms-based official rate sits beside it.
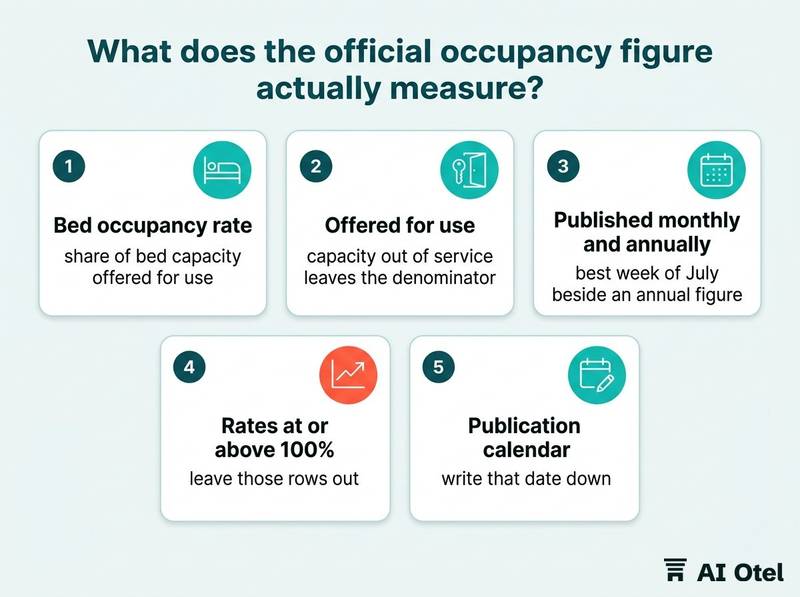
The Ministry's own metadata describes the variable as the extent to which the bed capacity offered for use was used during the month. That wording is the whole definition, and it is why the unit is beds. The 2025 rate is 49.54%, down from 51.91% in 2024 (Ministry of Culture and Tourism, accommodation statistics 2025).
Key pointThe official definition
The occupancy rate is the share of bed capacity offered for use that was used over the period (Ministry of Culture and Tourism, accommodation statistics metadata). For 2025 it is 49.54%, against 51.91% in 2024. It is a bed occupancy rate, never a rooms figure.
"Offered for use" is the operative phrase. Capacity you take out of service leaves the denominator, so closing a wing raises the rate without selling one bednight more. Decide your own rule for closed capacity and keep it constant, so your series stays comparable month to month.
The rate is published monthly and annually. Putting your best week of July beside an annual figure is the most common version of this mistake. The aggregate behind the rate: 98,981,217 arrivals and 252,323,483 overnight stays in certified facilities in 2025 (Ministry of Culture and Tourism, accommodation statistics 2025).
Some published rows show rates at or above 100%. Leave those rows out of your comparison rather than bending your own calculation to match them. The monthly bulletin follows a publication calendar; pull the figure on the day you build the sheet and write that date down, because the series is reissued. The calendar of which official figures come out when helps you time this.
Which facilities are inside the published average?
Ministry-certified İşletme and Basit Konaklama facilities. That population runs from five-star resorts to small pensions, so the headline average is not a description of a hotel like yours.
At 31 December 2025 there were 8,768 İşletme-certified facilities, of which 4,180 are classed as otel, 2,446 pansiyon, 454 apart and 112 butik. The otel group itself splits into 848 five-star, 985 four-star, 1,519 three-star, 454 two-star and 374 one-star (Ministry of Culture and Tourism, annual bulletin 2025). Basit Konaklama adds 12,385 facilities with 277,561 rooms, about 22 rooms per facility (Ministry of Culture and Tourism, certified accommodation statistics, August 2026).
Investment-certified facilities form a separate line in the stock tables, 455 facilities and 54,434 rooms, and are not the same population as the operating stock. The stock totals for August 2026 are published as provisional: 21,608 facilities, 928,638 rooms and 1,939,125 beds. Source: Ministry of Culture and Tourism, certified accommodation statistics, August 2026, provisional.
| Facility class | Occupancy rate, 2025 |
|---|---|
| 5-star | 61.0% |
| 4-star | 54.0% |
| 3-star | 42.1% |
| Boutique | 42.3% |
| Pension | 35.1% |
| All certified İşletme and Basit facilities | 49.54% |
Source: Ministry of Culture and Tourism, accommodation statistics 2025. Bed occupancy in Ministry-certified facilities.
Compare inside your class, not against the headline. Keep the vocabulary straight: the tables separate otel, pansiyon, apart and butik, and not every certified facility is a hotel. For the wider picture, Türkiye's tourism data collects the published series in one place.
How do I line up my own number before comparing?
Restate one calendar month in the official unit, in three steps: unit, denominator, then population and period.
Step one, unit. Build bednights from your registration and folio records: the occupants actually in each room each night, not the beds the room could hold. Roomnights sold multiplied by guests per room is a shortcut only if your guests-per-room figure is measured, not assumed.
Step two, denominator. Beds offered for use multiplied by the number of nights in the month, after removing rooms and beds that were out of service. Write the removal rule on the sheet.
Step three, population and period. Use the full calendar month, the same month of the comparison year, and the same facility class and certificate type. Never your peak week against an annual national figure.
Check what your own reports call occupancy. Open your occupancy report and confirm which unit it uses, because the label often does not say. Do the conversion for three consecutive months before you conclude anything: one month is a single data point and a single group booking can move it. Keep the rooms-based figure on the same sheet; it is the number your pricing and channel decisions run on, and it does not become wrong because the official figure uses another unit. The formulas for occupancy, ADR and RevPAR cover the common mistakes on that side.
ChecklistSix inputs to fix before computing
- The calendar month and its exact number of nights
- Rooms offered for sale each night
- Beds offered for use each night, after closed rooms
- Roomnights sold
- Bednights sold, counted from actual occupants
- The facility class and certificate type you will compare against, with the source and date of that figure
What can a gap mean, and when should you not compare at all?
A gap can mean five things, and only the last of them is about demand: a unit difference, a population difference, a period difference, a capacity difference, or a real difference in demand. You can only claim the fifth after the first four are gone.
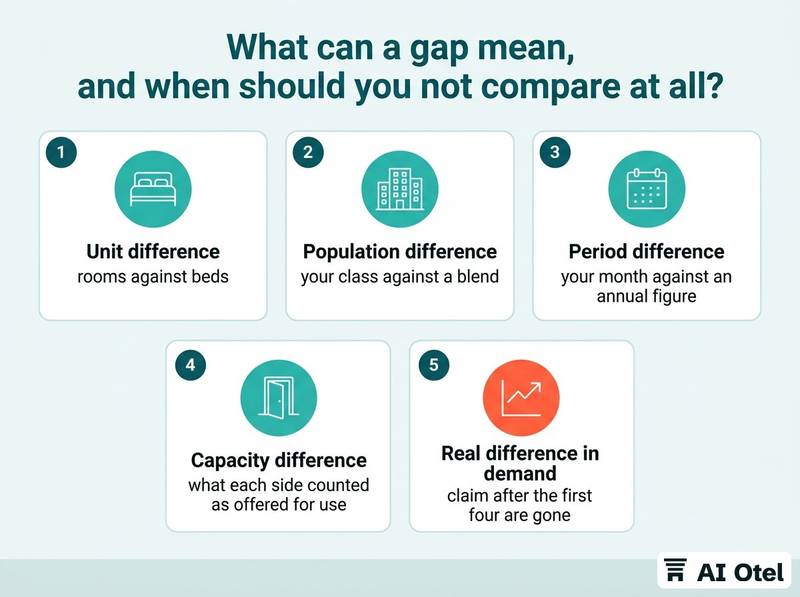
Unit is rooms against beds. Population is your class against a blend that includes pensions and small apart facilities. Period is your month against an annual figure. Capacity is what each side counted as offered for use.
The published figure carries no revenue, no rate and no channel mix. A gap says nothing about your average daily rate, your cost per occupied room or your profit. 2026 is flat so far (Ministry of Culture and Tourism, August 2026 bulletin; Hürriyet Daily News, 31 July 2026), so a large gap in a flat year is more likely to be definitional than a market shift. A couple of points on a small property in a single month sits inside ordinary variation; do not change a rate or a channel mix on it.
Watch outWhat a gap cannot support on its own
"We are behind the market"; "our pricing is wrong"; "our channel mix is bad"; "the team is underperforming". Eliminate unit, population, period and capacity first, then the residual gap is worth a conversation.
When not to compare
Skip the comparison in your opening month, a month with a renovation or a closed wing, or a month after your certificate class changed. Skip it when a group or allotment contract distorts the month, when a season-only property faces a twelve-month figure, and when the property is so small that one booking moves the rate by several points. Seasonality is the quiet one: a coastal hotel's July and a national monthly average are two different shapes of the same year, so read the monthly pattern before you read the gap.
What should the one-page comparison sheet contain?
Eight rows: the period, the unit, the numerator, the denominator, your capacity rule, the official figure with its source and date, the difference in points, and what the difference cannot mean.
Record the source and the date you pulled the official figure. The series is reissued, and a sheet without a date cannot be reproduced next quarter. Record your capacity rule in one sentence, so next month's number is built the same way and your own series stays comparable.
| Row on the sheet | What goes in it |
|---|---|
| Period | Calendar month, number of nights |
| Unit | Bed occupancy |
| Numerator | Bednights sold, with the source report |
| Denominator | Beds offered for use multiplied by nights |
| Capacity rule | How closed rooms were treated |
| Official figure | Rate, class, source, date pulled |
| Difference | In percentage points |
| What it cannot mean | One sentence |
State the difference in percentage points, not as a percentage of the official figure. Ten points is ten points; ten percent of 49.54 is a different and misleading sentence. Add one line on what the difference cannot mean, so a reader who picks the sheet up in six months does not turn it into a market claim.
File it with the month's revenue report. Occupancy is one of three numbers, and the other two are rate and revenue per available room. Review the sheet quarterly, not monthly: the definitional errors show up in the trend, not in a single month.
What to do next
Take last month, restate it as bednights against beds offered for use, and put the published figure for your own class beside it with its source and date. If the gap survives that, it is worth a conversation about demand. If it does not, you have avoided a decision built on two numbers that were never in the same unit.
Frequently asked questions
Why is my occupancy higher than the published average?
Usually the unit: single occupancy and children sharing beds leave the rooms figure unchanged but pull the bed figure down, so the two diverge, while the published figure counts beds. Then the population: the headline blends five-star hotels with pensions and small apart facilities. Then the period: your month against an annual figure. Check all three before reading anything into the gap.
Does the Ministry publish a rooms-based occupancy rate?
The published rate is a bed occupancy rate, the share of bed capacity offered for use that was used over the period. If you want a rooms comparison you build it yourself from your own roomnights, and you label it as your own figure. Never relabel the official rate as a rooms figure.
Should I compare with the national figure or with my facility class?
With your class, and for the same calendar month. The headline average covers 5-star hotels at 61.0% and pensions at 35.1% in 2025 (Ministry of Culture and Tourism, accommodation statistics 2025), so it describes neither of them. Class plus month plus certificate type is the smallest honest comparison.
How large a gap is worth acting on?
First remove the four definitional causes: unit, population, period and capacity offered. What remains on a small property in one month is often ordinary variation, since a single booking moves the rate by several points. A gap that persists across three months, after conversion, is the one worth a decision, and even then it says nothing about your rate or your profit.